Distributed Tracing
Automatic instrumentation at compile time. Every API call, database query, and pub/sub message traced without writing instrumentation code.
Zero instrumentation required
Encore instruments your code at compile time. Every request is traced automatically, including cross-service calls, database queries, and pub/sub messages.
- ✓100% request coverage
- ✓Cross-service correlation
- ✓Database query timing
- ✓Works locally and in production

Zero instrumentation
No OpenTelemetry SDKs, no manual span creation, no context propagation code. Encore's compiler instruments your application automatically at build time.
Complete coverage
API requests, database queries, pub/sub messages, HTTP clients, and cron jobs. Every operation traced with request/response data and timing.
Local + production
Same tracing experience in local development and cloud environments. Debug with production-quality tools from day one.
Your code stays clean
Write normal application code. Encore handles context propagation, span creation, and trace correlation across service boundaries automatically.
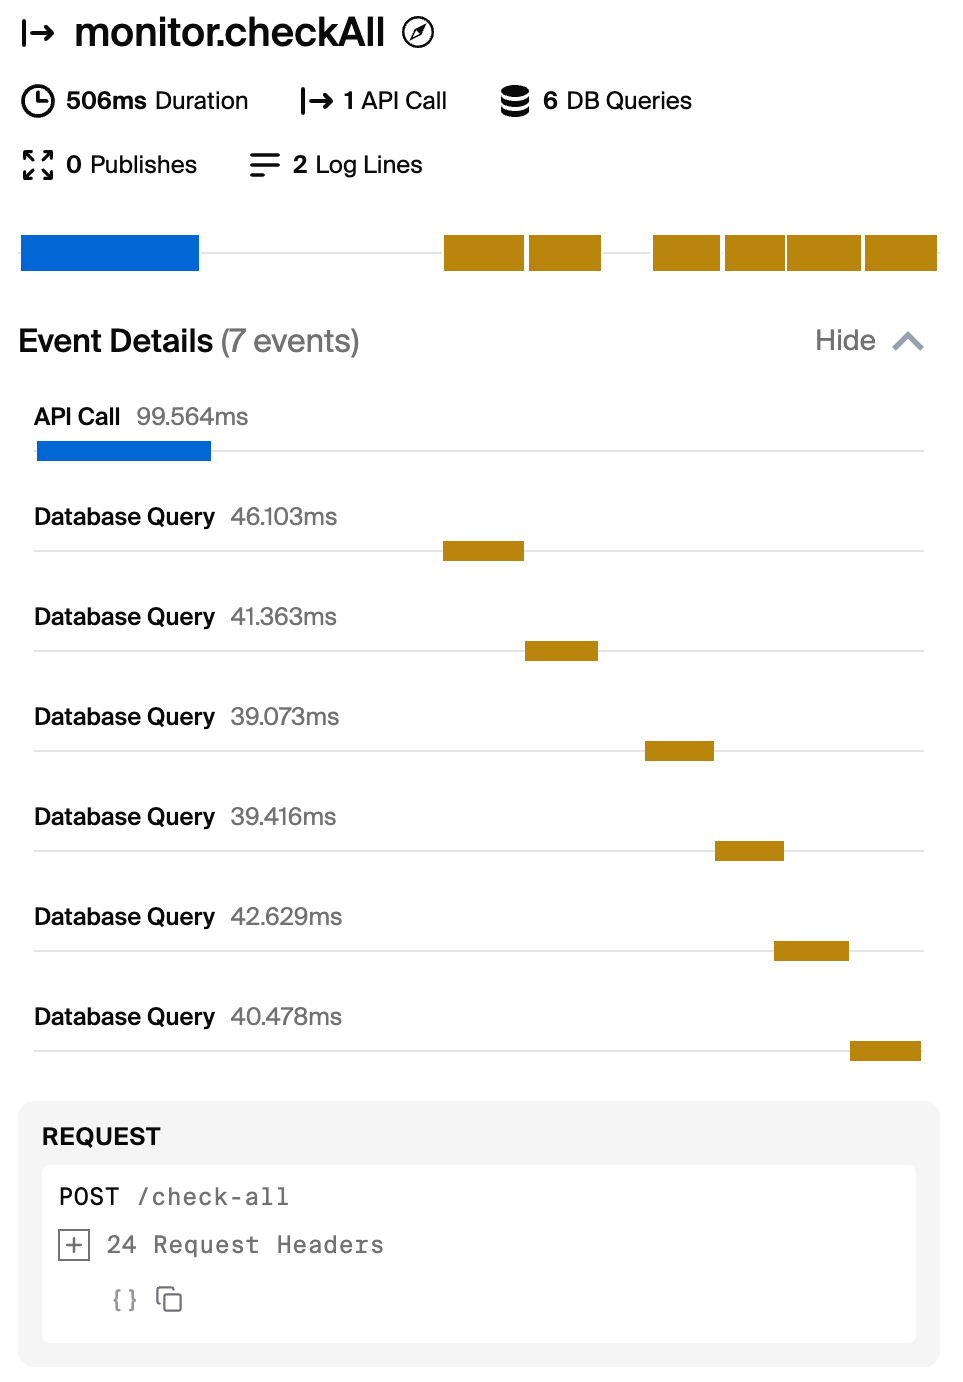
Each trace includes request/response bodies, SQL queries with bound parameters, pub/sub message payloads, and timing for every operation in the request chain.
import { api } from "encore.dev/api";
import { SQLDatabase } from "encore.dev/storage/sqldb";

const db = new SQLDatabase("users", {
  migrations: "./migrations"
});

export const getUser = api(
  { method: "GET", path: "/users/:id" },
  async ({ id }: { id: string }) => {
    // Automatically traced
    const user = await db.queryRow`
      SELECT * FROM users WHERE id = ${id}
    `;
    return user;
  }
);What's traced
Encore traces the full lifecycle of every request, giving you complete visibility into how your system behaves in development and production.
API Requests
HTTP requests across all services with full request/response bodies and headers
Database Queries
SQL queries with execution time, row counts, and the actual query with parameters
Pub/Sub Messages
Message publish and subscribe operations with payload data and delivery status
Service-to-Service Calls
Internal API calls between your services, automatically correlated in the trace
HTTP Client Requests
Outbound requests to third-party APIs with timing and response data
Cron Jobs
Scheduled task executions with duration and any errors that occurred
Debug locally with production-quality tools
When you run encore run, you get a local development dashboard with full distributed tracing atlocalhost:9400.
Click on any request to see the complete trace, including database queries, service-to-service calls, and any errors with full stack traces.
Export via OpenTelemetryComing soon
Encore's built-in tracing works immediately without configuration. Soon you'll be able to export traces via OpenTelemetry to Datadog, Grafana, Honeycomb, or any compatible backend.
Use Encore's dashboard for quick debugging, your existing tools for advanced correlation and alerting, or both.
- ○ Datadog
- ○ Grafana Cloud
- ○ Honeycomb
- ○ Jaeger
- ○ Any OTLP endpoint