 Ivan Cernja
Tracing in TypeScript: A Complete Guide
Everything you need to know about tracing TypeScript backend applications
When a request hits your backend and something goes wrong, logs tell you that it happened. Tracing tells you where and why. In a single-service app, you can get away with structured logging. Once you have multiple services, database calls, pub/sub messages, and external API calls, tracing becomes the only reliable way to understand what a request actually did.
This guide covers tracing in TypeScript backends from foundational concepts through production deployment, with practical code at every step. We'll start with the manual approach using OpenTelemetry, then look at how modern frameworks can eliminate most of this work entirely.
What Tracing Is
A trace is the full journey of a single request through your system. It starts when the request arrives and ends when the response is sent. Along the way, every significant operation (a database query, a call to another service, a pub/sub publish) gets recorded as a span within that trace.
Where logging gives you individual events ("user created", "email sent"), tracing gives you the causal chain: this API call triggered that database query, which took 340ms, followed by a service-to-service call that took 12ms. You see the whole picture, with timing.
For TypeScript backends, tracing matters more than you might expect. Async/await makes it easy to write code that fans out across multiple operations, but it also makes it harder to reason about what happened during a request. A trace reconstructs that timeline.
Tracing Concepts
Four concepts form the foundation.
Trace: A tree of operations representing one end-to-end request. Identified by a unique trace ID that propagates through every service involved.
Span: A single operation within a trace. Every span has a name, start time, duration, and a parent span. The root span represents the incoming request; child spans represent operations that happened during that request.
Context: The metadata (trace ID, current span ID) that links operations together. In TypeScript, this context needs to survive across await boundaries, which is less trivial than it sounds.
Attributes: Key-value pairs attached to a span. They capture details like http.method: "POST", db.statement: "SELECT ...", or user.id: "abc123".
Here's what a simple trace looks like in code:
// Root span: POST /orders
//   ├── Child span: SELECT FROM users (23ms)
//   ├── Child span: INSERT INTO orders (45ms)
//   └── Child span: POST /payments.charge (120ms)
//        └── Child span: Stripe API call (98ms)
Each level of nesting is a parent-child relationship. The total request time is the root span's duration. The breakdown shows exactly where time was spent.
What to Trace
Not everything deserves a span. The goal is to capture operations that have meaningful latency or failure modes. Here are the categories that matter.
API Endpoints
Every incoming request should be the root span of a trace. Capture the method, path, status code, and response time.
// What the trace captures:
// Span: "POST /orders"
// Attributes: http.method=POST, http.route=/orders, http.status_code=201
// Duration: 189ms

app.post("/orders", async (req, res) => {
  const order = await createOrder(req.body);
  res.status(201).json(order);
});
Database Queries
Database calls are the most common source of latency. Trace every query with the statement (or a sanitized version), table name, and row count.
// What the trace captures:
// Span: "db.query"
// Attributes: db.system=postgresql, db.statement="SELECT * FROM users WHERE id=$1"
// Duration: 23ms

const user = await db.query("SELECT * FROM users WHERE id = $1", [userId]);
Service-to-Service Calls
In a distributed system, outbound HTTP calls to other services should carry the trace context forward. The calling service creates a span; the receiving service continues the same trace.
// Calling service:
// Span: "POST /payments/charge"
// Attributes: peer.service=payments, http.status_code=200
// Duration: 120ms

const result = await fetch("http://payments-service/charge", {
  method: "POST",
  headers: {
    "Content-Type": "application/json",
    // Trace context propagated in headers
    "traceparent": `00-${traceId}-${spanId}-01`,
  },
  body: JSON.stringify({ amount: 100, currency: "usd" }),
});
Pub/Sub Operations
Message publishing and consumption should both be traced, linked by the trace context embedded in the message. For more on event-driven architecture patterns, see our dedicated guide.
// Publisher span: "topic.publish orders.created"
// Attributes: messaging.system=pubsub, messaging.destination=orders.created
// Duration: 8ms

await topic.publish({ orderId: "abc", userId: "xyz" });

// Subscriber span: "topic.process orders.created"
// (separate trace, linked to publisher)
Cache Operations
Cache hits and misses are worth tracing because they explain performance variations between requests.
// Span: "cache.get user:abc123"
// Attributes: cache.hit=true
// Duration: 1ms

const cached = await cache.get(`user:${userId}`);
External HTTP Calls
Third-party API calls (Stripe, SendGrid, S3) are outside your control and often the slowest part of a request. Trace them.
// Span: "HTTP POST api.stripe.com/v1/charges"
// Attributes: http.url=https://api.stripe.com/v1/charges, http.status_code=200
// Duration: 340ms

const charge = await stripe.charges.create({ amount: 1000, currency: "usd" });
Context Propagation in TypeScript
The hardest part of tracing in TypeScript is keeping trace context alive across async boundaries. When you await a database call inside a request handler, the trace context needs to survive that suspension and resume on the right continuation.
JavaScript doesn't have goroutine-local storage like Go's context.Context. Instead, Node.js provides AsyncLocalStorage, part of the async_hooks module. It creates a storage context that automatically propagates through await, setTimeout, Promise.then, and other async operations.
Here's how it works:
import { AsyncLocalStorage } from "node:async_hooks";

interface TraceContext {
  traceId: string;
  spanId: string;
}

const traceStorage = new AsyncLocalStorage<TraceContext>();

// Start a context for an incoming request
function handleRequest(req: Request) {
  const ctx: TraceContext = {
    traceId: generateTraceId(),
    spanId: generateSpanId(),
  };

  // Everything inside this callback (and its async descendants)
  // can access the trace context
  traceStorage.run(ctx, async () => {
    const user = await getUser(req.userId);
    const order = await createOrder(user, req.items);
    return order;
  });
}

// Deep in your call stack, in a completely different file:
async function getUser(id: string) {
  const ctx = traceStorage.getStore(); // { traceId: "abc...", spanId: "def..." }
  // Create a child span using the parent context
  const childSpan = startSpan("db.query", ctx);
  const result = await db.query("SELECT * FROM users WHERE id = $1", [id]);
  childSpan.end();
  return result;
}
The key insight: AsyncLocalStorage tracks the async execution chain automatically. When getUser calls db.query and awaits the result, the storage context is preserved. No need to pass trace context as a function argument through every layer of your application.
This is how every tracing library in the Node.js ecosystem works under the hood. OpenTelemetry, dd-trace, and Encore's built-in tracing all rely on AsyncLocalStorage to propagate context without polluting your function signatures.
Both Deno and Bun also support AsyncLocalStorage, so this approach works across JavaScript runtimes.
Manual Tracing with OpenTelemetry
OpenTelemetry is the standard for manual instrumentation. Here's a condensed setup for a TypeScript backend.
Install Packages
npm install @opentelemetry/api \
  @opentelemetry/sdk-node \
  @opentelemetry/sdk-trace-node \
  @opentelemetry/exporter-trace-otlp-http \
  @opentelemetry/resources \
  @opentelemetry/semantic-conventions \
  @opentelemetry/instrumentation-http \
  @opentelemetry/instrumentation-express \
  @opentelemetry/instrumentation-pg
Configure the SDK
Create this file and import it before anything else in your application:
// tracing.ts
import { NodeSDK } from "@opentelemetry/sdk-node";
import { OTLPTraceExporter } from "@opentelemetry/exporter-trace-otlp-http";
import { Resource } from "@opentelemetry/resources";
import {
  ATTR_SERVICE_NAME,
  ATTR_SERVICE_VERSION,
} from "@opentelemetry/semantic-conventions";
import { HttpInstrumentation } from "@opentelemetry/instrumentation-http";
import { ExpressInstrumentation } from "@opentelemetry/instrumentation-express";
import { PgInstrumentation } from "@opentelemetry/instrumentation-pg";

const sdk = new NodeSDK({
  resource: new Resource({
    [ATTR_SERVICE_NAME]: "my-api",
    [ATTR_SERVICE_VERSION]: "1.0.0",
  }),
  traceExporter: new OTLPTraceExporter({
    url: "http://localhost:4318/v1/traces",
  }),
  instrumentations: [
    new HttpInstrumentation(),
    new ExpressInstrumentation(),
    new PgInstrumentation(),
  ],
});

sdk.start();
Create Custom Spans
For operations that aren't covered by auto-instrumentation libraries:
import { trace } from "@opentelemetry/api";

const tracer = trace.getTracer("my-api");

export async function processOrder(orderId: string) {
  return tracer.startActiveSpan("processOrder", async (span) => {
    try {
      span.setAttribute("order.id", orderId);

      const order = await getOrder(orderId);
      span.setAttribute("order.total", order.total);

      await chargePayment(order);
      await sendConfirmation(order);

      span.setStatus({ code: 1 }); // OK
      return order;
    } catch (error) {
      span.setStatus({ code: 2, message: String(error) }); // ERROR
      span.recordException(error as Error);
      throw error;
    } finally {
      span.end();
    }
  });
}
This works. But look at the ratio of tracing code to business logic. The processOrder function is three lines of actual work wrapped in 15 lines of instrumentation. Multiply that across every function in your codebase and the maintenance cost becomes real.
You also need to remember to call span.end() in every code path, handle errors correctly with recordException, and ensure the SDK is initialized before your app starts. Miss any of these and you get incomplete or missing traces.
Automatic Tracing with Encore
Encore.ts takes a different approach. Instead of manually instrumenting your code, the framework's compiler understands your application structure and generates tracing automatically.
The key is typed primitives. When you define an API endpoint with api(), a database with SQLDatabase, or a pub/sub topic with Topic, Encore knows what operations exist at compile time. The Rust-based runtime instruments everything without any code from you.
Here's an order processing endpoint with Encore:
import { api } from "encore.dev/api";
import { db } from "./db";
import { payments } from "~encore/clients";

export const create = api(
  { expose: true, method: "POST", path: "/orders" },
  async (req: CreateOrderRequest): Promise<Order> => {
    const user = await db.queryRow<User>`
      SELECT * FROM users WHERE id = ${req.userId}
    `;

    const order = await db.queryRow<Order>`
      INSERT INTO orders (user_id, total)
      VALUES (${user!.id}, ${req.total})
      RETURNING *
    `;

    await payments.charge({ amount: order!.total });

    return order!;
  }
);
Compare this with the OpenTelemetry version from the previous section, where the same three operations required nested startActiveSpan calls, manual span.end() in every code path, error recording, and context propagation headers. The Encore version produces even more detailed trace data (root span for the API call, child spans for each database query, child span for the service-to-service call) with none of that instrumentation code.
This is possible because the framework knows what db.queryRow is, what payments.charge is, and what api() is. The compiler sees the typed primitives and the Rust runtime instruments them automatically.
The local development dashboard at localhost:9400 shows traces for every request during development, including database queries, service calls, and pub/sub messages.
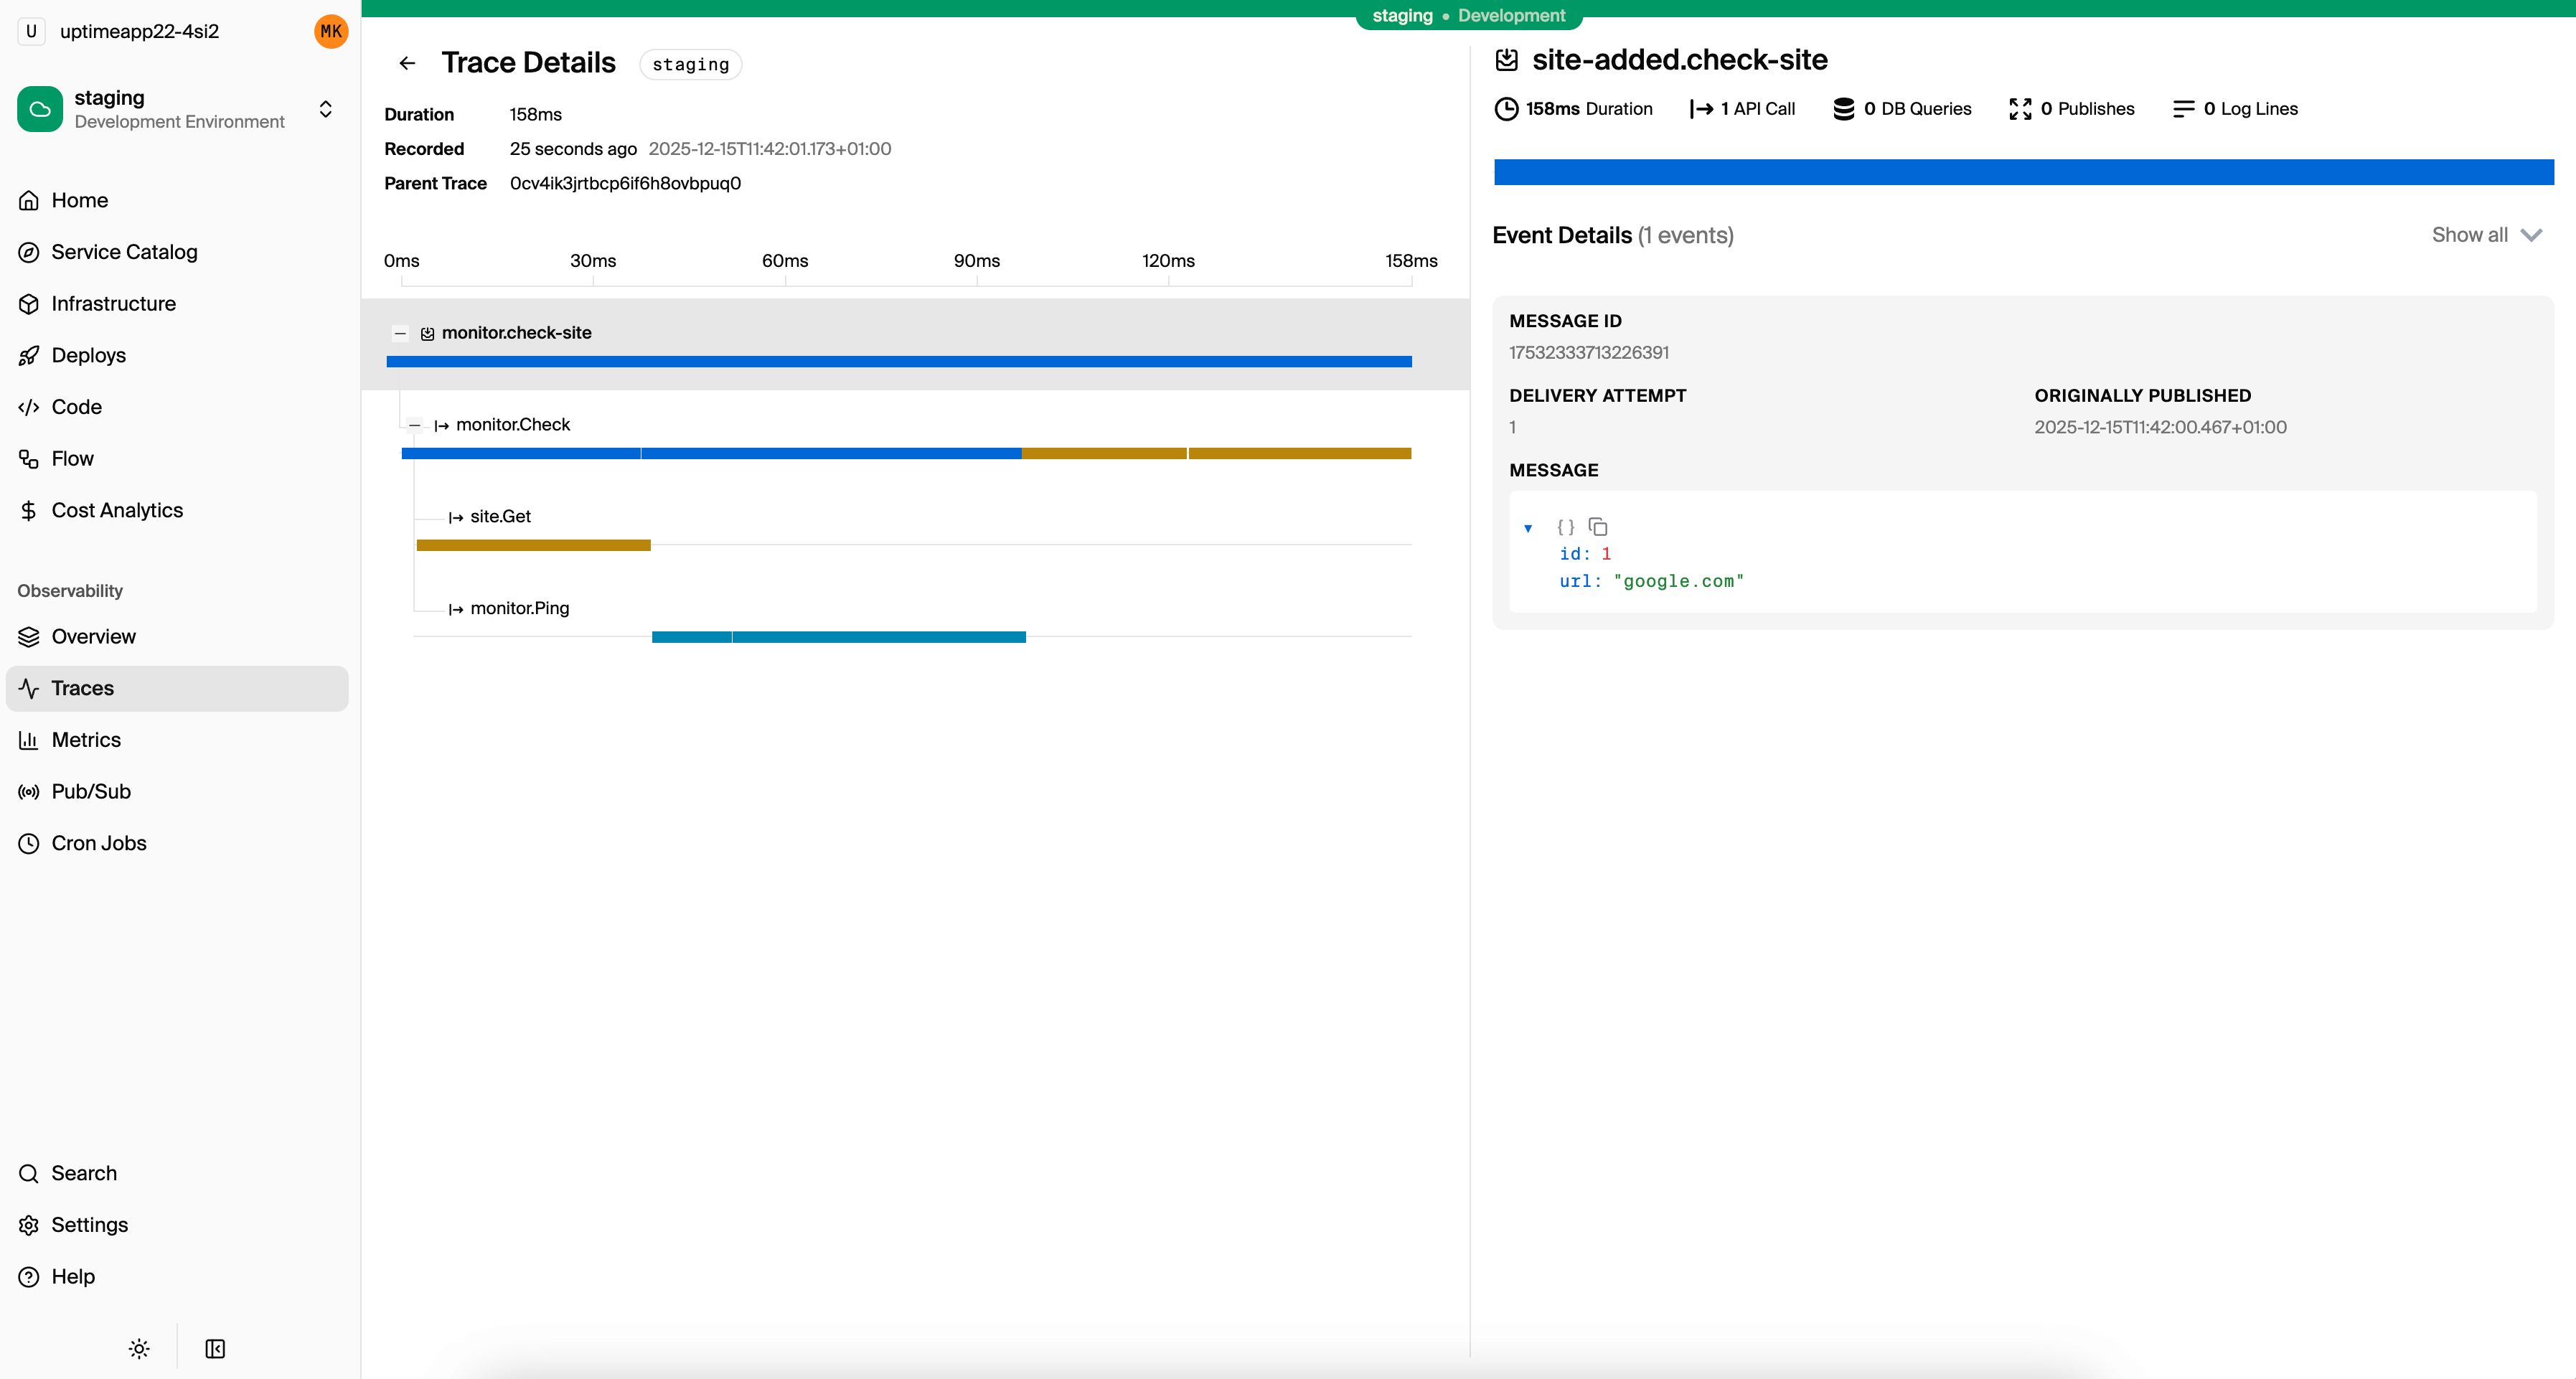
Analyzing Traces
Collecting traces is only useful if you know how to read them. Most tracing UIs display traces as waterfall charts: horizontal bars showing each span's start time and duration, nested by parent-child relationships.
Here's what to look for:
Long Spans
A span that takes significantly longer than expected points to the bottleneck. If your API endpoint takes 800ms and the database query inside it takes 750ms, the fix isn't in your application code. It's in your query or indexes.
Sequential Calls That Could Be Parallel
If your trace shows three independent database queries running one after another, you're leaving performance on the table:
// Sequential: 150ms total
const user = await db.queryRow`SELECT * FROM users WHERE id = ${id}`;
const prefs = await db.queryRow`SELECT * FROM preferences WHERE user_id = ${id}`;
const stats = await db.queryRow`SELECT * FROM stats WHERE user_id = ${id}`;

// Parallel: ~50ms total (bounded by the slowest query)
const [user, prefs, stats] = await Promise.all([
  db.queryRow`SELECT * FROM users WHERE id = ${id}`,
  db.queryRow`SELECT * FROM preferences WHERE user_id = ${id}`,
  db.queryRow`SELECT * FROM stats WHERE user_id = ${id}`,
]);
In a waterfall chart, sequential calls appear as stacked bars. Parallel calls appear as overlapping bars. The visual difference is obvious.
N+1 Query Patterns
If you see one query followed by N identical queries with different parameters, you have an N+1 problem. The trace makes it visible:
GET /orders (523ms)
├── SELECT * FROM orders WHERE user_id=$1 (12ms)
├── SELECT * FROM products WHERE id=$1 (8ms)   // order 1
├── SELECT * FROM products WHERE id=$1 (7ms)   // order 2
├── SELECT * FROM products WHERE id=$1 (9ms)   // order 3
├── SELECT * FROM products WHERE id=$1 (8ms)   // order 4
└── ... (45 more queries)
The fix is a single query with WHERE id IN (...) or a JOIN.
Error Propagation
When a span has an error, the trace shows exactly which operation failed and how the error propagated up. A failed database query deep in a service call chain is immediately visible rather than hidden in log noise.
Production Tracing
Running tracing in production introduces concerns that don't exist in development.
Sampling
Tracing every request in production generates enormous amounts of data. Sampling strategies reduce volume while preserving usefulness:
Head-based sampling decides at the start of a request whether to trace it. Simple but blind, since it might skip the one slow request you care about.
// Sample 10% of requests
const sampler = new TraceIdRatioBasedSampler(0.1);
Tail-based sampling collects all trace data, then decides after the request completes whether to keep it. You can keep all traces with errors or high latency, and sample the rest. More useful but requires a collector that buffers spans.
Adaptive sampling adjusts the rate based on traffic volume. At 100 requests/second, sample 10%. At 10 requests/second, keep everything.
For most applications, a combination works well: keep 100% of error traces, 100% of traces above a latency threshold (e.g., 500ms), and sample 5-10% of normal traffic.
Storage and Cost Management
Trace data adds up. A service handling 1000 requests/second with 5 spans per request produces ~430 million spans per day. Set retention policies (7 days for detailed traces, 30 days for aggregates), drop low-value spans like health checks, and use sampling to keep costs under control.
Exporting to External Tools
In production, you'll want traces in a dedicated observability platform. Common options:
- Jaeger: Open source, self-hosted. Good for teams that want full control.
- Grafana Tempo: Open source backend, pairs with Grafana dashboards.
- Datadog APM: Managed service with broad integrations.
- Honeycomb: Purpose-built for trace analysis with high-cardinality queries.
With OpenTelemetry, switching between backends is a configuration change. You swap the exporter, not your instrumentation code.
With Encore Cloud, tracing data is collected and displayed automatically in the built-in trace viewer, giving you a detailed view of every request across all your services without managing collectors or exporters yourself.
Quick Start with Encore
If you want tracing that works without setup, here's how to get started with Encore.
Install the CLI:
# macOS
brew install encoredev/tap/encore

# Linux
curl -L https://encore.dev/install.sh | bash

# Windows
iwr https://encore.dev/install.ps1 | iex
Create a project:
encore app create my-app --example=ts/hello-world
cd my-app
Start the development server:
encore run
Open localhost:9400 and make a few requests. Every request is traced automatically: API calls, database queries, service-to-service calls, pub/sub messages. Everything is instrumented out of the box.
As your application grows to multiple services, the traces grow with it. Service-to-service calls are correlated automatically. Database queries show up as child spans. The local dashboard gives you the same trace quality you'd get from a production observability platform, available from the first line of code.
For production, connect to Encore Cloud and deploy with git push encore. Tracing continues to work with the same zero-configuration approach, with trace events billed on a usage-based pricing model.
Want to jump straight to a running app? Clone this starter and deploy it to your own cloud.