 Ivan Cernja
Tracing vs Logging vs Metrics: When to Use Each
The three pillars of observability and how they work together
Observability is not one tool. It's three complementary signals that answer different questions about your system. Metrics tell you something is wrong. Logs tell you what went wrong. Traces tell you where it went wrong and why it took so long.
Most teams start with logging, add metrics when they need dashboards, and bolt on tracing when debugging distributed systems gets painful. Understanding what each signal does well (and where it falls short) helps you reach for the right tool first instead of digging through the wrong data for twenty minutes.
What Metrics Tell You
Metrics are numeric measurements collected over time. They answer aggregate questions: how many requests per second, what's the error rate, what does the latency distribution look like.
There are three common metric types:
- Counters track cumulative values that only go up. Total requests served, total errors, total bytes processed. You derive rates from counters (requests per second = counter delta / time delta).
- Gauges track values that go up and down. Current active connections, CPU usage, queue depth.
- Histograms track distributions of values. Request latency broken into buckets so you can compute percentiles (p50, p95, p99).
Here's what defining custom metrics looks like in a TypeScript backend:
import { Counter, CounterGroup, Gauge } from "encore.dev/metrics";

// Simple counter: total orders processed
const ordersProcessed = new Counter("orders_processed");

// Counter with labels: track by status
interface OrderLabels {
  status: string;
}
const ordersByStatus = new CounterGroup<OrderLabels>("orders_by_status");

// Gauge: current queue depth
const queueDepth = new Gauge("queue_depth");

// Usage in a handler
async function processOrder(order: Order) {
  ordersProcessed.increment();
  ordersByStatus.with({ status: "received" }).increment();
  queueDepth.set(await getQueueSize());
  // ...
}
Metrics are good for:
- Alerting. "Error rate exceeded 1% for 5 minutes" is a metrics alert. You can't efficiently alert on individual log lines at scale.
- Dashboards. Request rate, latency percentiles, and error budgets are all metrics visualizations.
- SLOs. "99.9% of requests complete in under 200ms" is a statement about metric percentiles.
- Capacity planning. Trends over days and weeks show you where you're running out of headroom.
Metrics are bad for debugging specific requests. They tell you that 2% of requests are failing, but not which ones or why.
What Logs Tell You
Logs are timestamped event records. They capture what happened during a specific operation, with enough context to understand it later.
The difference between useful logs and noise is structure. Unstructured logs (console.log("error processing order")) are almost useless at scale. Structured logs with consistent fields are searchable:
import log from "encore.dev/log";

export const processPayment = api(
  { expose: true, method: "POST", path: "/payments" },
  async (req: PaymentRequest): Promise<PaymentResponse> => {
    log.info("processing payment", {
      orderId: req.orderId,
      amount: req.amount,
      currency: req.currency,
    });

    try {
      const result = await chargeCard(req);
      log.info("payment succeeded", {
        orderId: req.orderId,
        transactionId: result.transactionId,
      });
      return result;
    } catch (err) {
      log.error(err, "payment failed", {
        orderId: req.orderId,
        amount: req.amount,
      });
      throw err;
    }
  }
);
The log.with() method lets you attach context that carries across multiple log statements, so you don't repeat yourself:
const logger = log.with({ orderId: req.orderId, userId: req.userId });
logger.info("starting checkout");
logger.info("applying discount", { discountCode: req.code });
logger.info("checkout complete", { total: finalAmount });
Logs are good for:
- Debugging specific errors. When you know a request failed, logs tell you what happened in that request.
- Audit trails. Who did what, when, with what parameters.
- Business events. "User upgraded to Pro" or "Payment of $49 processed" are log events, not metrics.
Logs are bad for understanding timing or flow across services. A single request that touches three services produces logs in three different places. Without something to connect them, you're grep-ing through three log streams by timestamp and hoping.
What Traces Tell You
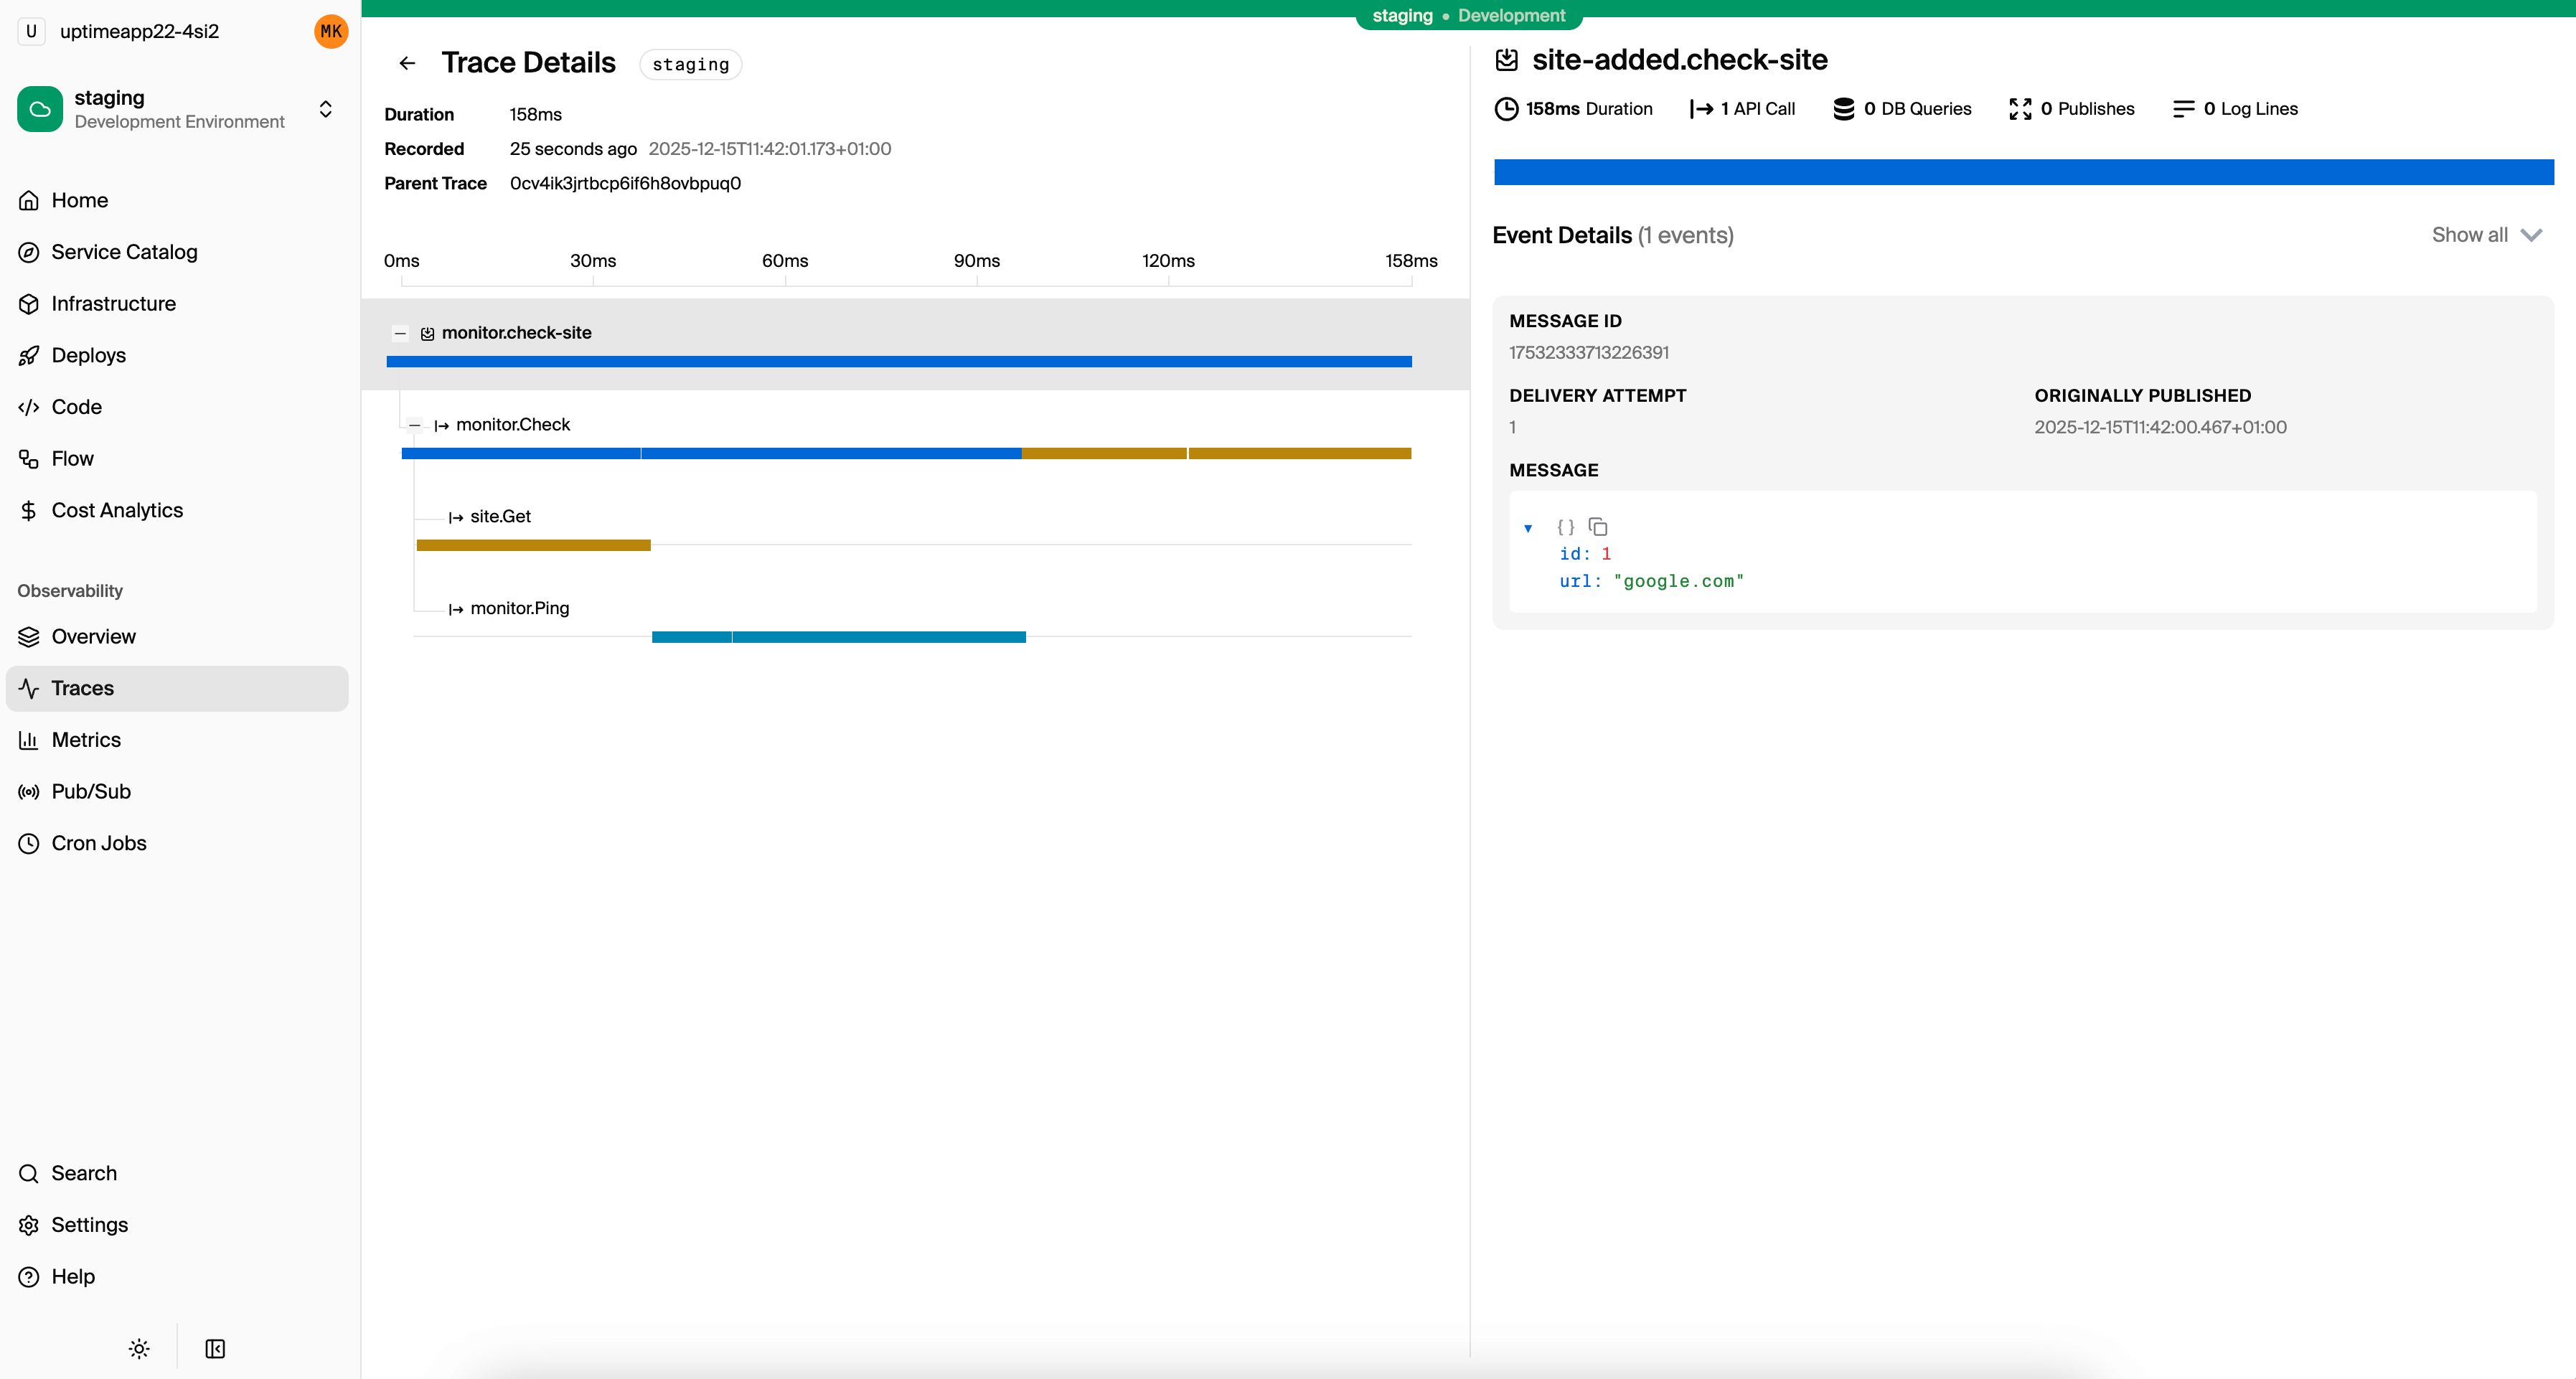
Traces follow a single request as it flows through your system. Each operation within the request (an API call, a database query, an HTTP request to an external service) becomes a span with a start time, duration, and metadata. Spans nest inside each other to form a tree.
A trace for an API request might look like this:
POST /api/orders/create                          [200ms]
├─ validate-input                                [ 2ms]
├─ db.query: SELECT * FROM users WHERE id = $1   [ 8ms]
├─ db.query: INSERT INTO orders (...)            [12ms]
├─ POST payments.charge (service call)           [150ms]
│  ├─ db.query: SELECT * FROM accounts ...       [ 5ms]
│  ├─ HTTP POST stripe.com/v1/charges            [120ms]
│  └─ db.query: INSERT INTO transactions ...     [ 9ms]
└─ topic.publish: order-created                  [ 3ms]
This immediately tells you the request took 200ms, the payment service call dominated at 150ms, and within that, the Stripe API call was the bottleneck at 120ms. No amount of log searching or metric querying gives you that picture this quickly.
Traces are good for:
- Debugging slow requests. The waterfall view shows you exactly where time is spent.
- Understanding service dependencies. Traces reveal the actual call graph between your services, not the one you drew on a whiteboard six months ago.
- Finding bottlenecks. When your p99 latency spikes, traces for slow requests show you the common cause.
- Root cause analysis. An error in one service that was triggered by bad data from another service shows up as a connected trace.
Traces are less useful for aggregate analysis. You don't look at individual traces to understand your overall error rate; that's what metrics are for.
When to Use Which
Here's a practical decision table for common debugging scenarios:
| Scenario | Start with | Then use |
|---|---|---|
| "Our error rate just spiked" | Metrics to confirm the spike and identify which endpoint | Traces to find failing requests and see where errors originate |
| "This specific request returned a 500" | Logs to find the error message and stack trace | Traces to see the full request flow and what failed upstream |
| "The checkout endpoint is slow" | Traces to find a slow request and see the span breakdown | Metrics to check if it's a sustained regression or intermittent |
| "How much traffic does the orders service handle?" | Metrics (request rate counter) | That's it. Metrics are the answer here. |
| "Did user X's payment go through?" | Logs filtered by user ID and payment event | Traces if you need to see why it failed or was slow |
| "Something changed after yesterday's deploy" | Metrics to compare before/after error rates and latency | Traces to sample requests and find what's different |
The pattern: metrics for detection and aggregates, traces for understanding flow and timing, logs for specific event details.
How They Work Together
Here's a concrete debugging workflow that uses all three signals. Your on-call engineer gets paged at 2 AM because the error rate on the /api/orders/create endpoint crossed the alerting threshold.
Step 1: Metrics confirm the problem. The dashboard shows the error rate jumped from 0.1% to 4.5% starting at 1:47 AM. The latency p99 also spiked. This tells you what's broken and when it started, but not why.
Step 2: Traces reveal the pattern. You pull up traces for failed requests on that endpoint. The trace waterfall shows the same thing on every failing request: the span for payments.charge is returning errors after about 5 seconds (a timeout). The requests that succeed have that span completing in 100-200ms as usual. Something is wrong with the payment service or its downstream dependency.
Step 3: Logs give you the specifics. You look at the logs from the payment service for those failing traces. The error is connection timeout: stripe.com/v1/charges. Stripe is having an outage. Your service is timing out waiting for Stripe, and the errors bubble up to the orders endpoint.
Step 4: Back to metrics for scope. You check the payment service metrics directly. 100% of Stripe API calls are failing. But only 4.5% of order creates are failing because most orders use account credits, not card payments. Now you know the blast radius.
Fifteen minutes of debugging across all three signals, with a clear picture of what happened. Without traces, you'd be guessing which downstream call was failing. Without metrics, you wouldn't know the blast radius. Without logs, you wouldn't know it was specifically Stripe.
Getting All Three Without Separate Tools
Setting up observability the traditional way means configuring three separate concerns. You need a metrics pipeline (Prometheus or similar, plus Grafana for dashboards), a log aggregation system (the ELK stack or a managed service), and distributed tracing (OpenTelemetry instrumentation, a collector, and a backend like Jaeger or Tempo). Each one requires setup, configuration, and ongoing maintenance.
For teams building with Encore.ts, all three signals come from the framework without separate configuration.
Tracing is automatic. Every API call, database query, service-to-service call, and Pub/Sub message is traced out of the box. You don't add OpenTelemetry instrumentation or configure trace propagation. The trace waterfall from the example above is what you see for every request in the local development dashboard and in Encore Cloud.
import { api } from "encore.dev/api";
import { SQLDatabase } from "encore.dev/storage/sqldb";

const db = new SQLDatabase("orders", { migrations: "./migrations" });

export const create = api(
  { expose: true, method: "POST", path: "/orders" },
  async (req: CreateOrderRequest): Promise<Order> => {
    // This database query appears as a span in the trace automatically
    const order = await db.queryRow<Order>`
      INSERT INTO orders (user_id, total)
      VALUES (${req.userId}, ${req.total})
      RETURNING *
    `;
    // This service call is traced and correlated automatically
    await payments.charge({ orderId: order!.id, amount: req.total });
    return order!;
  }
);
Everything is instrumented automatically. The trace captures every database query, its duration, and how it relates to the parent request.
Structured logging is built in. The encore.dev/log module produces structured logs that automatically attach to the active trace. When you view a trace, you see the logs from that request inline.
import log from "encore.dev/log";

const logger = log.with({ service: "orders" });

export const create = api(
  { expose: true, method: "POST", path: "/orders" },
  async (req: CreateOrderRequest): Promise<Order> => {
    logger.info("creating order", { userId: req.userId, total: req.total });
    // ... business logic ...
    logger.info("order created", { orderId: order.id });
    return order;
  }
);
Logs appear in traces, in the local dashboard, and can be streamed from any environment with encore logs --env=prod.
Metrics work without a separate pipeline. Define counters and gauges in your application code, and they're collected automatically. With Encore Cloud, metrics feed into built-in dashboards and can be exported to Grafana or Datadog.
import { Counter, Gauge } from "encore.dev/metrics";

const activeOrders = new Gauge("active_orders");
const ordersCreated = new Counter("orders_created");

export const create = api(
  { expose: true, method: "POST", path: "/orders" },
  async (req: CreateOrderRequest): Promise<Order> => {
    // ... create order ...
    ordersCreated.increment();
    activeOrders.set(await getActiveOrderCount());
    return order;
  }
);
The result is that you write your application logic, and all three observability signals are available from the same codebase without configuring separate systems. During local development, the dashboard at localhost:9400 shows traces with logs and metrics. In production, Encore Cloud provides the same data with alerting and third-party integrations.
The Practical Takeaway
Metrics, logs, and traces each answer different questions. Using only one of them is like debugging with one eye closed. Metrics detect problems and measure impact. Logs record specifics about individual events. Traces connect events across time and services into a coherent picture.
The common trap is setting up each signal as a separate project with its own infrastructure. If that overhead is what's stopped you from having full observability, frameworks like Encore that provide all three signals by default remove that barrier entirely.
Want to jump straight to a running app? Clone this starter and deploy it to your own cloud.
Related Reading
- OpenTelemetry for Node.js: Complete Setup Guide - Setting up OTel from scratch
- How to Trace Requests in a Node.js Backend - Practical approaches to request tracing
- Distributed Tracing for TypeScript APIs - Framework-level tracing for TypeScript
- Distributed Tracing for Microservices - Tracing across service boundaries
- Best Tracing Tools for TypeScript - Comparing tracing solutions
- How to Build a REST API with TypeScript - Full tutorial with observability included
- How to Build Microservices with TypeScript - Distributed tracing across services
- Express.js vs Encore.ts - Observability comparison
- Encore Tracing Documentation - Deep dive on automatic tracing
- Encore Metrics Documentation - Custom metrics API reference